Introduction
Nowadays it is common to hear the terms "distributed systems", "microservices" and "Kubernetes". Along with these terms comes the need to monitor those services:
- Are errors occurring? Which ones? Where did they occur?
- What is the CPU and memory usage?
- What is the average time a request takes to be processed?
These and other questions lead to: how do we monitor those services? Is monitoring alone enough or do we need observability?
In this article we will discover what observability is, why it is important for distributed systems and how to implement it in .NET.
Fundamental Concepts
Observability rests on three pillars: logs, traces and metrics. I will briefly explain what each one means.
Logs are detailed messages about events that occurred in the application, usually formatted as structured (JSON) or semi-structured text; they are used to diagnose errors and understand system behavior at specific moments. We can record errors or specific events with proper exception handling.
Metrics are numerical values collected over time that represent the state or performance of a system (e.g.: average response time, number of requests per second, memory usage, number of sales, number of registered customers, etc.).
Traces are chained records that show the path of a request through multiple components or services, allowing the identification of bottlenecks and dependencies in distributed architectures. With this pillar we can understand the entire timeline of a request.
The pillars integrate: metrics answer what is happening, traces tell us where it is happening, and logs explain why it is happening.
detect (metric) → isolate (trace) → explain (log).
Now that we know what observability is, what the pillars are and how they relate, we can move on to implementation.
Configuring observability in practice — Logs
Starting with logs, we will use the Serilog library to generate structured and enriched logs.
Prerequisites:
Create a Web App project in .NET 8 and add the packages below to get started:
dotnet add package Serilog
dotnet add package Serilog.AspNetCore
In Program.cs, initialize and configure the logging system:
using Serilog; // import the library

var builder = WebApplication.CreateBuilder(args);

builder.Services.AddEndpointsApiExplorer();
builder.Services.AddSwaggerGen();

Log.Logger = new LoggerConfiguration() // initialize the logging system
    .WriteTo.Console() // display logs in the console
    .CreateLogger();

builder.Host.UseSerilog(); // Set Serilog as the logging system

var app = builder.Build();

if (app.Environment.IsDevelopment())
{
    app.UseSwagger();
    app.UseSwaggerUI();
}

app.UseHttpsRedirection();

app.MapGet("/", () =>
{
    return true;
});

app.Run();
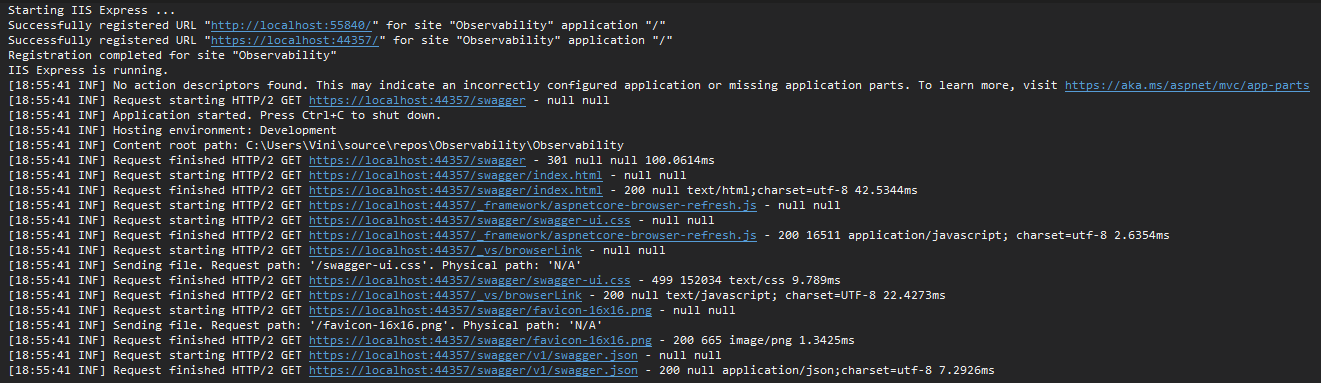
With this simple configuration we can already visualize the logs in the application's output window.
Now we need to structure the logs and define a pattern so we can later collect and visualize this data.
To do that it's very simple: just add JSON formatting:
Log.Logger = new LoggerConfiguration() // initialize the logging system
    .WriteTo.Console(new JsonFormatter()) // format the output to JSON
    .CreateLogger();
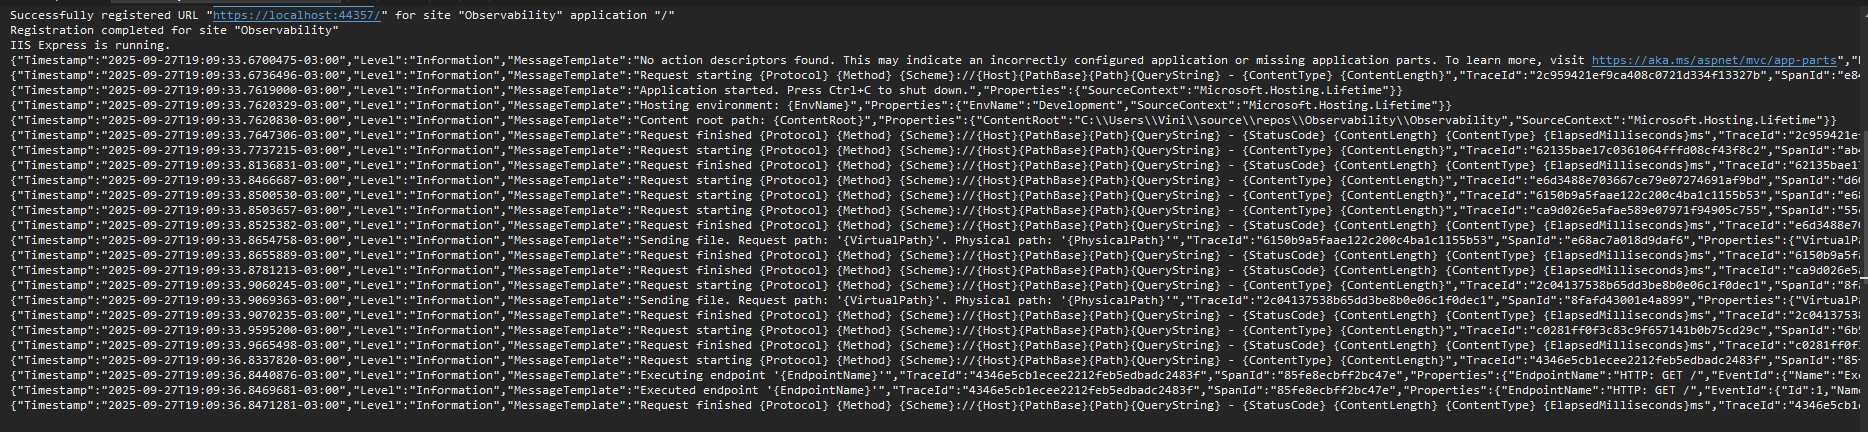
Now the logs are structured in JSON format:
When logs are structured, we already have the TraceId information. This property allows correlating logs from the same request. For example, during request processing we can add logs manually, both for information and to record errors:
app.MapGet("/", () =>
{
    try
    {
        Log.Information("Request received...");
        // Processing request...
        Log.Information("Request processed...");
        return Results.Ok();
    }
    catch(Exception ex)
    {
        Log.Error($"An error occurred... {ex}");
    }
    return Results.BadRequest();
});
This way we can correlate the manually generated logs (Log.Information, Log.Error, etc.) with the request logs. The request will also display data such as the payload and the authentication token; this allows knowing exactly what the user sent and who sent it.
With this simple approach, we have structured logs ready to be viewed and analyzed.
For more details, consult the Serilog documentation.
Configuring OpenSearch
OpenSearch is an open source search and analytics platform, a fork derived from Elasticsearch, used to index, store and query large volumes of logs, metrics and other structured or semi-structured data.
Now that we have logs structured as JSON, we only need to send them to OpenSearch. For that we will need a sink.
Each sink defines how and where logs will be stored or displayed — for example: console, files, a database or observability systems (OpenSearch, Elasticsearch, Application Insights, etc.).
Configure the sink to send logs to OpenSearch:
Log.Logger = new LoggerConfiguration() // initialize the logging system
    .WriteTo.Console(new JsonFormatter()) // output logs to console and format as JSON
    .WriteTo.OpenSearch(new OpenSearchSinkOptions(new Uri("http://opensearch:9200")) // send logs to OpenSearch
    {
        IndexFormat = "dotnet-logs-{0:yyyy.MM.dd}",
        CustomFormatter = new JsonFormatter() // format logs sent to OpenSearch as JSON
    })
    .CreateLogger();
With this, we need to configure OpenSearch and OpenSearch Dashboards (the data visualizer). We can spin up containers with the API, OpenSearch and OpenSearch Dashboards:
services:
  api:
    build: .
    container_name: dotnet-api
    environment:
      - DOTNET_ENVIRONMENT=Development
    ports:
      - "5000:8080"
    depends_on:
      - opensearch

  opensearch:
    image: opensearchproject/opensearch:3.2.0
    container_name: opensearch
    environment:
      - discovery.type=single-node
      - DISABLE_INSTALL_DEMO_CONFIG=true
      - plugins.security.disabled=true
    ports:
      - "9200:9200"


  dashboards:
    image: opensearchproject/opensearch-dashboards:3.2.0
    container_name: opensearch-dashboards
    environment:
       - OPENSEARCH_HOSTS=http://opensearch:9200
       - DISABLE_SECURITY_DASHBOARDS_PLUGIN=true
    ports:
      - "5601:5601"
    depends_on:
      - opensearch
Now run docker compose up -d and you will have the infrastructure online.
Final steps to set up logs:
- Access the API to create the index:
http://localhost:5000/. - Access OpenSearch Dashboards:
http://localhost:5601/.
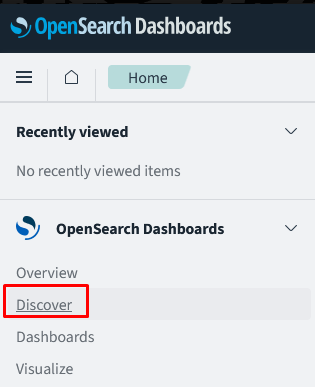
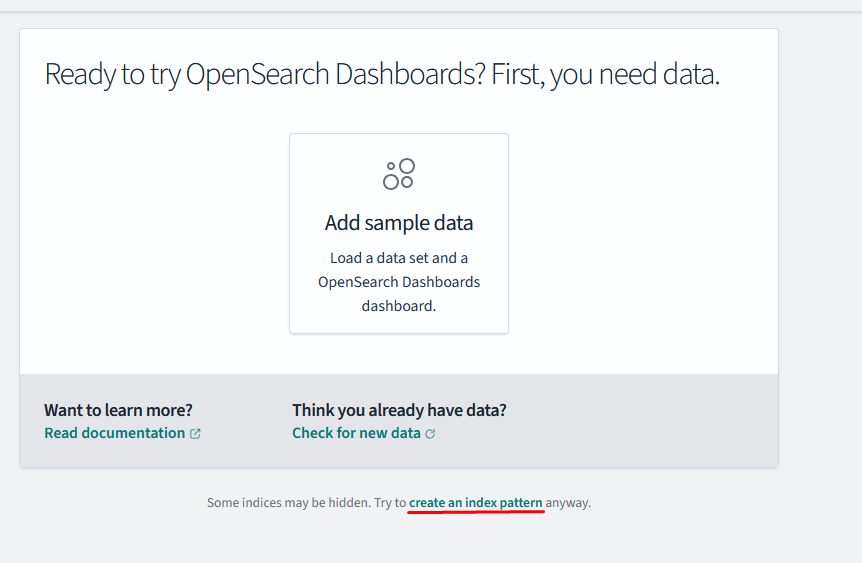
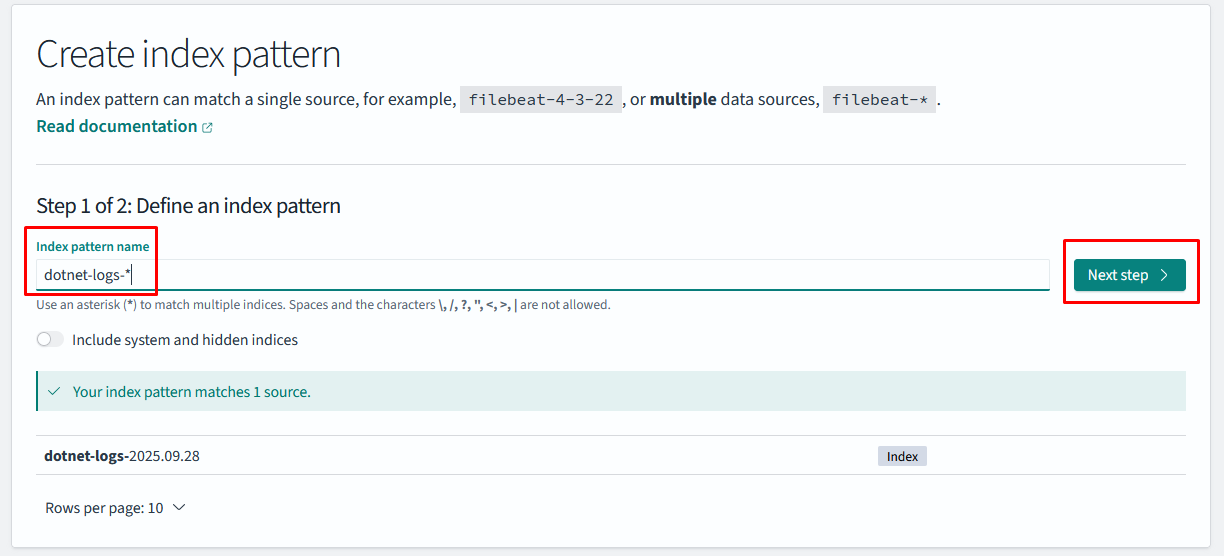
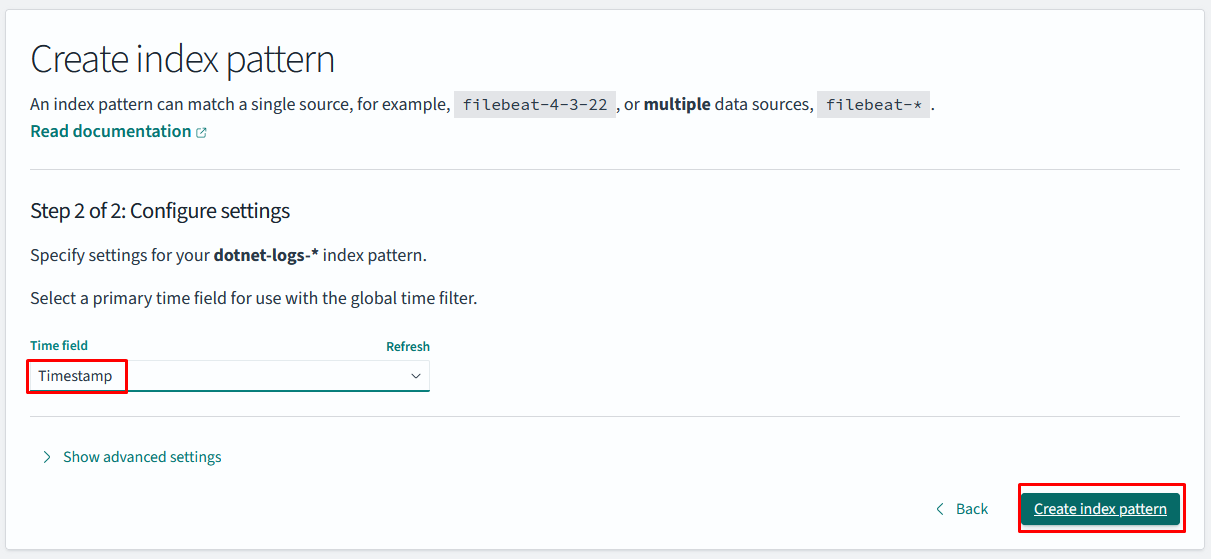
Go again to OpenSearch Dashboards → Discover and you will be able to see the logs generated by the API:
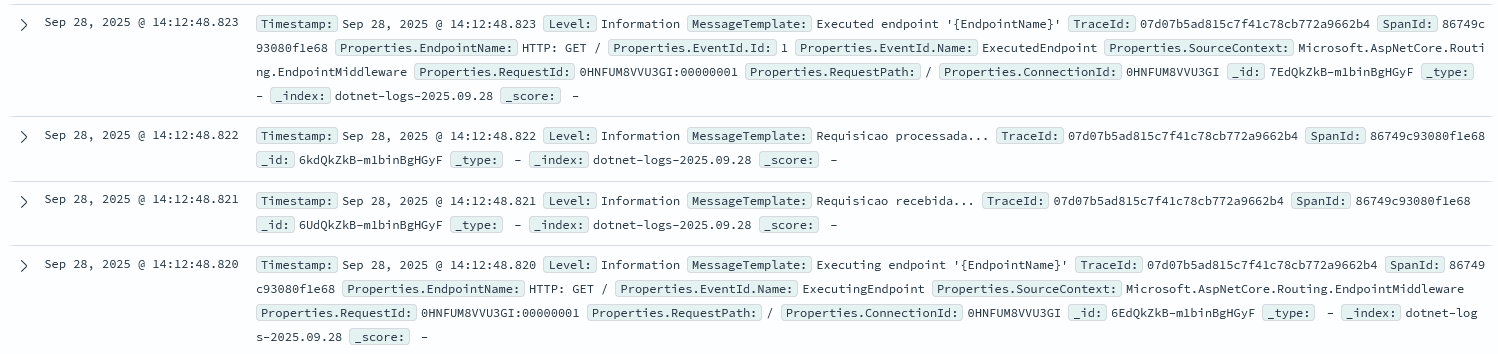
With that, we finish the development for the first pillar: logs.
Configuring observability in practice — Metrics
For this pillar we will use OpenTelemetry to collect and export metrics, Prometheus to store data and Grafana to visualize it.
Start by installing the packages below:
dotnet add package OpenTelemetry.Exporter.OpenTelemetryProtocol
dotnet add package OpenTelemetry.Exporter.Prometheus.AspNetCore
dotnet add package OpenTelemetry.Extensions.Hosting
dotnet add package OpenTelemetry.Instrumentation.AspNetCore
Collecting metrics with OpenTelemetry is straightforward:
#region metrics
builder.Services.AddOpenTelemetry()
    .ConfigureResource(resource => resource
        .AddService(serviceName: builder.Environment.ApplicationName))
    .WithMetrics(metrics => metrics
        .AddAspNetCoreInstrumentation() // automatically collects request data
        .AddPrometheusExporter()); // export metrics to Prometheus
#endregion


builder.Host.UseSerilog(); // Set Serilog as the logging system

var app = builder.Build();

app.MapPrometheusScrapingEndpoint(); // Exposes the /metrics endpoint and makes metrics available
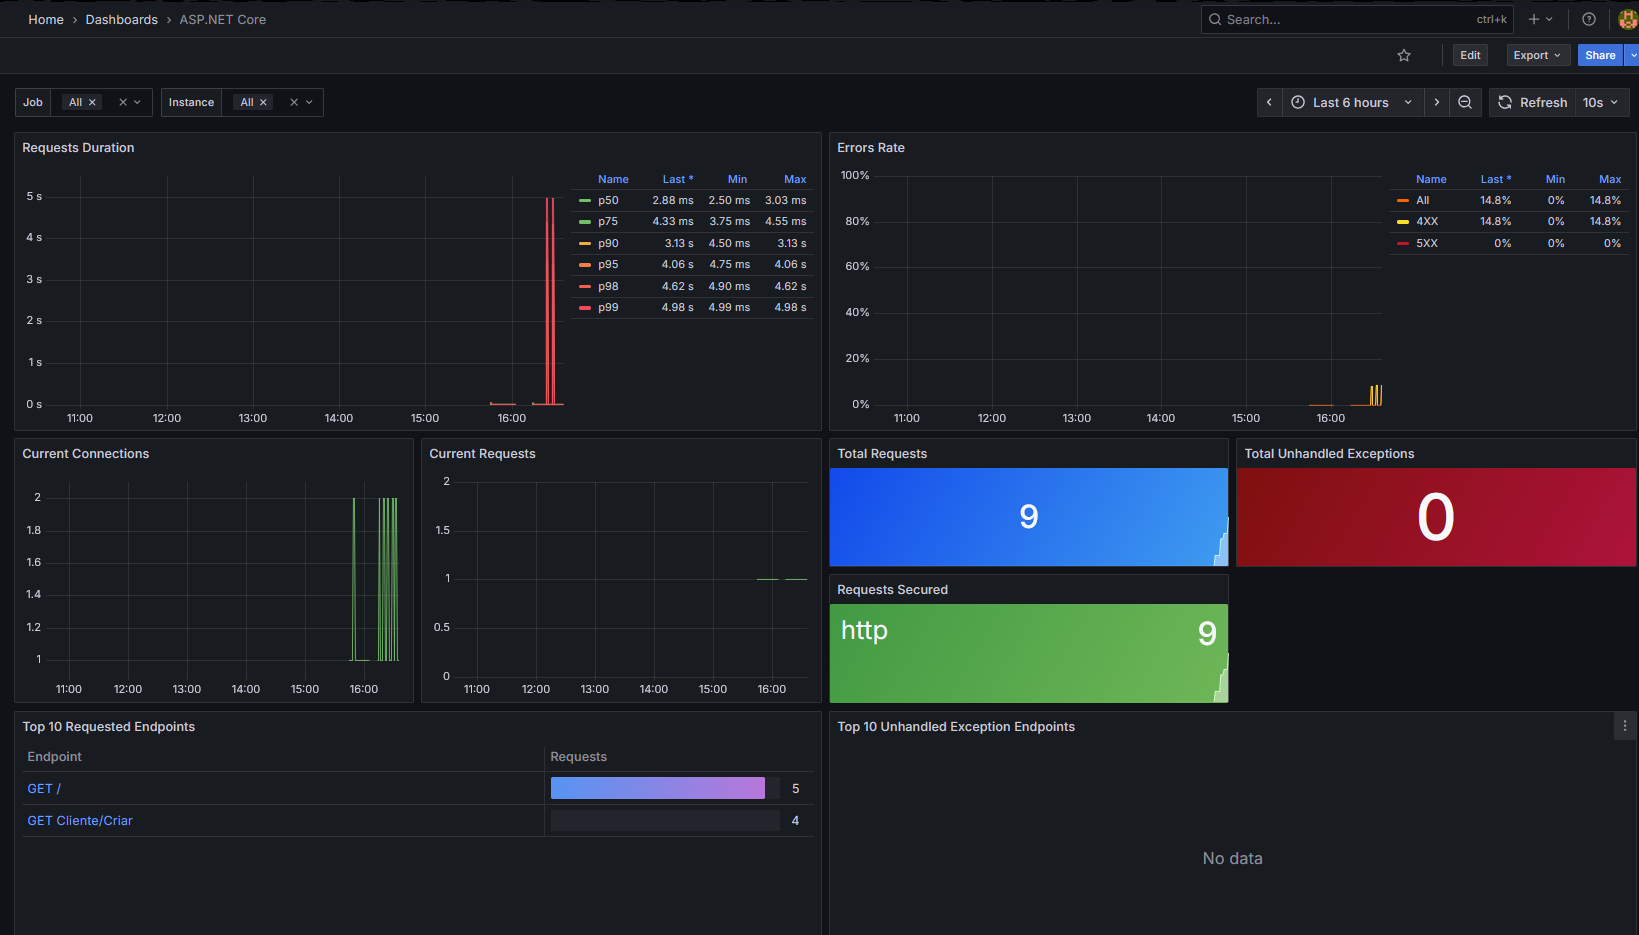
With this we have some metrics like:
- Number of requests arriving at our API
- Which endpoints received requests and how many
- Average request duration
- Quantity of 4xx and 5xx errors
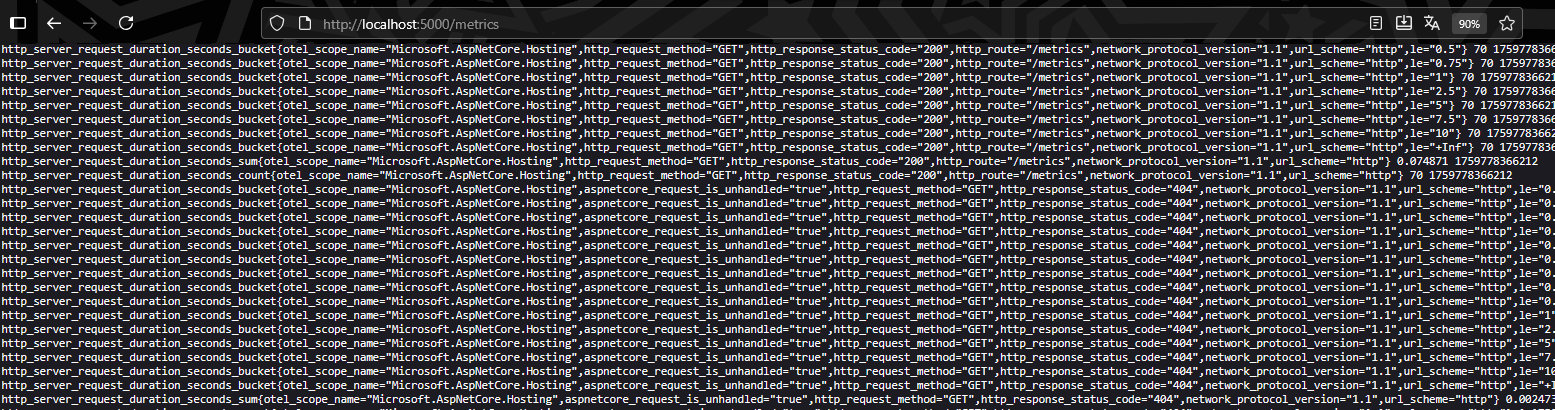
You can access the /metrics endpoint (http://localhost:5000/metrics) to verify that metrics are being collected properly.
To configure Prometheus, create a prometheus.yml file and add the following:
global:
  scrape_interval: 15s

scrape_configs:
  - job_name: 'dotnet-api'
    static_configs:
      - targets: ['api:8080']
    metrics_path: '/metrics'
    scrape_interval: 5s
Add Prometheus and Grafana to docker-compose:
prometheus:
  image: prom/prometheus:latest
  container_name: prometheus
  ports:
    - "9090:9090"
  volumes:
    - ./prometheus.yml:/etc/prometheus/prometheus.yml
  depends_on:
      - api

grafana:
  image: grafana/grafana:latest
  container_name: grafana
  ports:
    - "3000:3000"
  environment:
    - GF_SECURITY_ADMIN_PASSWORD=admin
    - GF_SECURITY_ADMIN_USER=admin
  depends_on:
      - prometheus
Then access Grafana to visualize the metrics.
Basic configuration:
- Access Grafana.
- Connect Prometheus to Grafana: Data Sources > Add new Data Source > Prometheus > Prometheus server url: http://prometheus:9090 > Save & Test.
- Import a pre-configured dashboard:
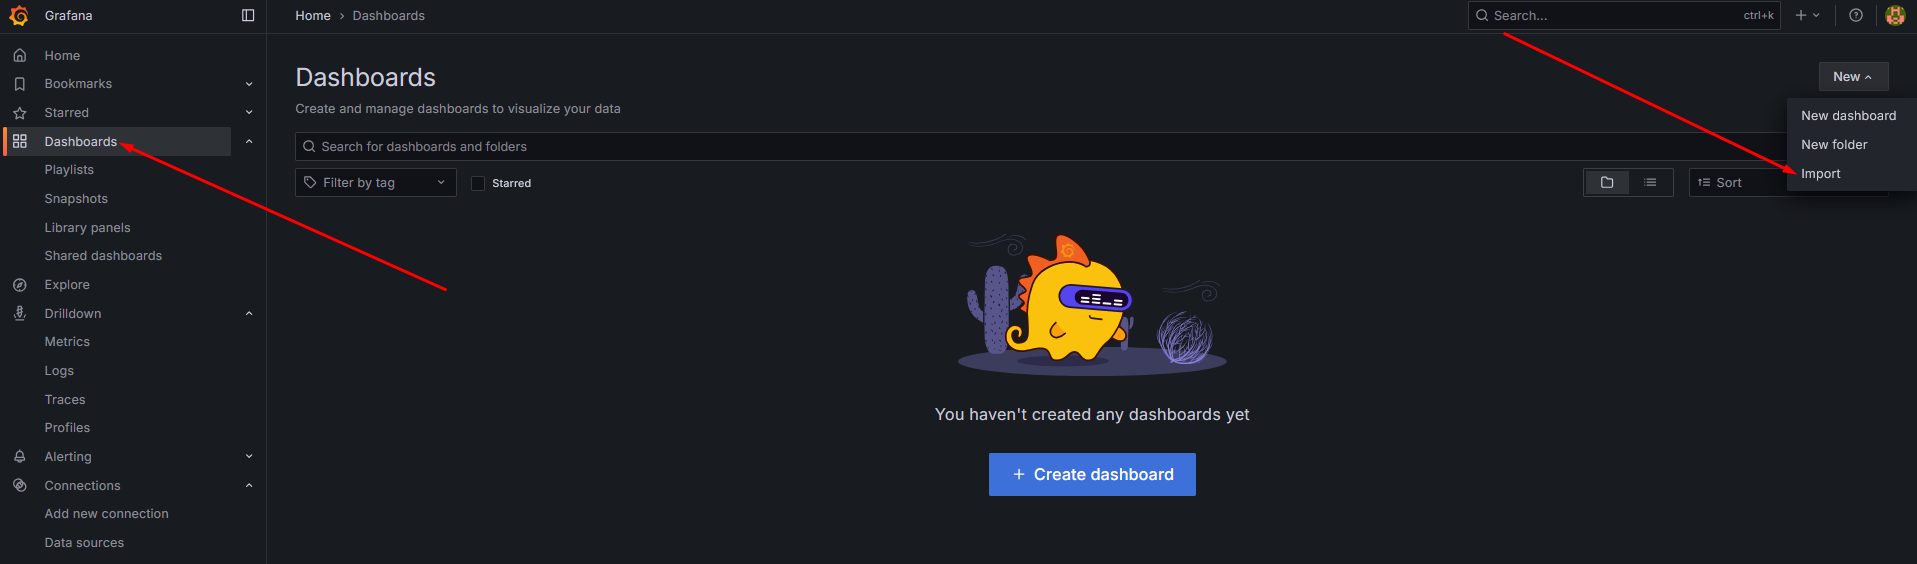
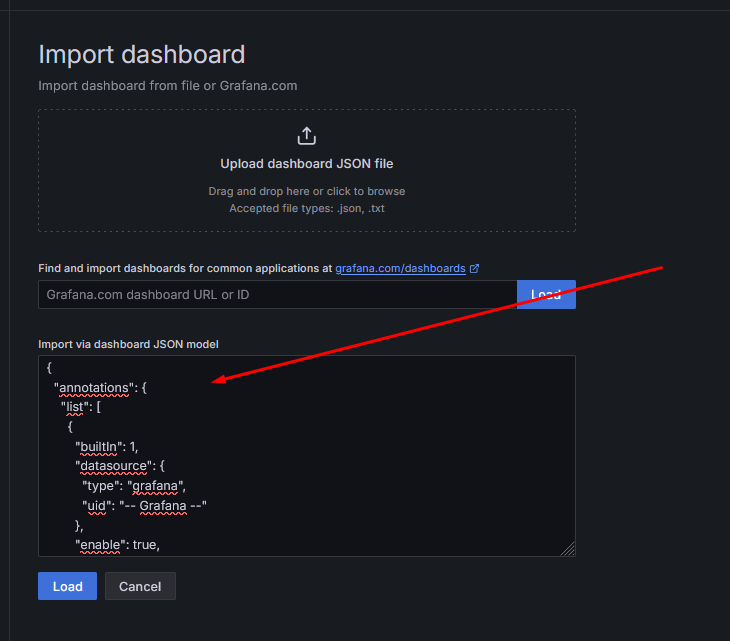
The dashboard code can be found here.
Now we can see metrics in real time:
You can also add custom metrics, according to the OpenTelemetry documentation.
With that, we finish the second pillar of observability: metrics.
Configuring observability in practice — Traces
Configuring tracing is as simple as configuring metrics. Add the code below:
#region metrics
builder.Services.AddOpenTelemetry()
    .ConfigureResource(resource => resource
        .AddService(serviceName: builder.Environment.ApplicationName))
    .WithMetrics(metrics => metrics
        .AddAspNetCoreInstrumentation() // automatically collects request data
        .AddPrometheusExporter()) // export metrics to Prometheus
#endregion
#region traces
    .WithTracing(traces => traces
        .AddAspNetCoreInstrumentation() // automatically collects request data
        .AddOtlpExporter(options =>
        {
            options.Endpoint = new Uri("http://collector:4317"); // export data to Grafana Tempo
            options.Protocol = OtlpExportProtocol.Grpc;
        }));
#endregion
Create an .yml file to configure the OpenTelemetry Collector, which collects traces and exports them to Grafana Tempo (otel-collector-config.yml):
receivers:
  otlp:
    protocols:
      grpc:
      http:

exporters:
  logging:
    loglevel: info
  otlp:
    endpoint: tempo:4317
    tls:
        insecure: true

service:
  pipelines:
    traces:
      receivers: [otlp]
      exporters: [logging, otlp]
Create a configuration file for Grafana Tempo (tempo.yml):
server:
  http_listen_port: 3200

distributor:
  receivers:
    otlp:
      protocols:
        grpc:
            endpoint: 0.0.0.0:4317
        http:

storage:
  trace:
    backend: local
    local:
      path: /var/tempo/traces
    wal:
      path: /var/tempo/wal
Finally, add the Grafana Tempo and Collector images to docker-compose.yml:
tempo:
  image: grafana/tempo:latest
  container_name: tempo
  command: ["-config.file=/etc/tempo/tempo.yml"]
  volumes:
    - ./tempo.yml:/etc/tempo/tempo.yml
    - ./data/tempo:/var/tempo
collector:
  image: otel/opentelemetry-collector-contrib:0.81.0
  container_name: collector
  command: [ "--config=/etc/collector.yml" ]
  ports:
      - "4317:4317"
  volumes:
      - ./otel-collector-config.yml:/etc/collector.yml
  depends_on:
      - tempo
Ready: environment configured. Now follow the steps to observe traces:
- Access the API to generate traces.
- Access Grafana.
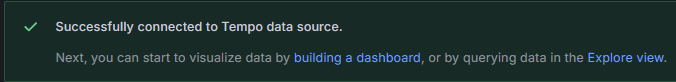
- Left side menu → Connections → Add New connection → search for Tempo and select it → Add new data source → URL:
http://tempo:3200→ scroll to the bottom of the page and click "Save & Test" → the following message should be shown:
- Click on Explore view → Search → All collected traces will be listed.
Ready: now we have the three pillars configured and ready to use.
Tips
- You can relate traces with logs through the TraceId. Just copy it from any trace and search for it in OpenSearch Dashboards; this will show all logs related to that trace.
- You can add an entire exception to a trace. To do this, make a few small changes:
Add a source in the metrics/tracing configuration:
#region traces
    .WithTracing(traces => traces
        .AddSource("Observability")
        .AddAspNetCoreInstrumentation() // automatically collects request data
        .AddOtlpExporter(options =>
        {
            options.Endpoint = new Uri("http://collector:4317"); // export data to Grafana Tempo
            options.Protocol = OtlpExportProtocol.Grpc;
        }));
#endregion
Create an endpoint to simulate an error:
app.MapGet("Traces/Exception", () =>
{
    var activitySource = new ActivitySource("Observability");
    using var activity = activitySource.StartActivity("Traces.Exception");
    try
    {
        throw new Exception("an unexpected error occurred...");
    }
    catch (Exception ex)
    {
        activity?.AddException(ex);
        return Results.Problem(statusCode: 500, detail: ex.Message);
    }
});
The parameter passed to the ActivitySource constructor must have the same name as the Source configured earlier.
The AddException() method will add exception data such as the error message and the stack trace.

Note: this article covers only the basic configuration for observability. There are many additional resources that can be added. See the OpenTelemetry documentation and the Serilog documentation for more details.
Conclusion
Observability is not an add-on but an essential requirement for any modern distributed system. Logs, metrics and traces make up the core of an ecosystem that enables understanding internal application behavior, quickly identifying anomalies and acting precisely before issues impact end users. By implementing tools such as Serilog, OpenTelemetry, Prometheus, Grafana and OpenSearch, we can achieve a clear view of the application state and its interactions. Observability provides the necessary context to diagnose complex failures, optimize performance and ensure resilience. Observable systems not only help detect failures but also accelerate learning about the system as a whole. In a landscape increasingly oriented toward microservices and distributed infrastructure, understanding what happens in each part of the application becomes the difference between reacting to chaos and anticipating it. Remember that observability is not exclusive to microservices; it can and should be used in monoliths as well. If your API is a monolith, observability will serve you too.
Access the source code with all details here.